
Epigenetic Clocks Explained: Horvath, Hannum, DNAm GrimAge
Review of DNA methylation epigenetic clocks: Horvath 2013, Hannum, GrimAge, PhenoAge, DunedinPACE, and their use as biomarkers in peptide research.
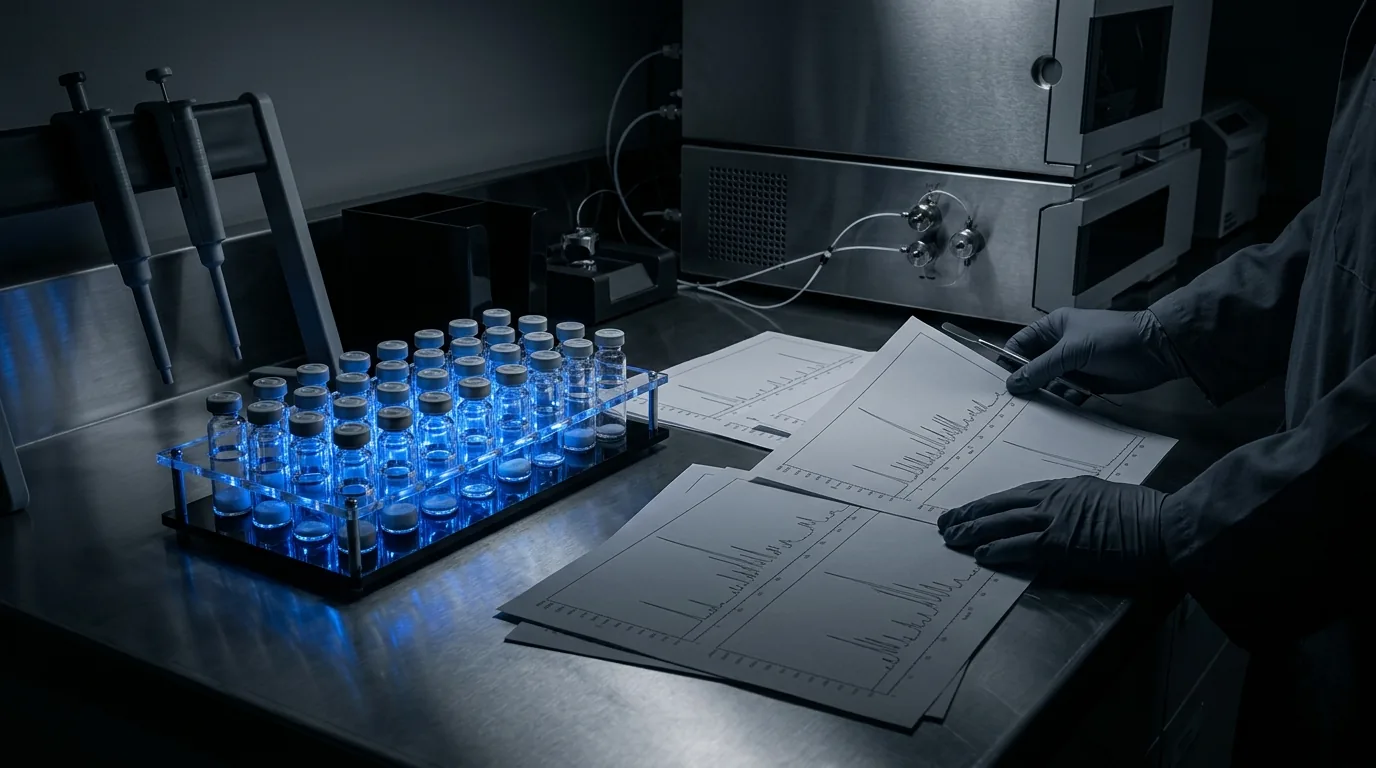
For laboratory research use only. Not for human consumption.
Why Epigenetic Clocks Became the Gold Standard of Biological Age
Epigenetic clocks are mathematical models that estimate biological age from patterns of DNA methylation at specific cytosine-phosphate-guanine (CpG) sites across the genome. Since the first-generation Horvath clock was published in 2013, epigenetic age estimators have become the most widely cited biomarkers of biological aging, with second- and third-generation clocks such as PhenoAge, GrimAge, and DunedinPACE extending the methodology to disease risk and pace-of-aging estimation.
This review explains the mathematical basis of the major clocks, their input data requirements, their documented accuracy for chronological and biological age prediction, and their limitations when used as outcome biomarkers in research on longevity peptides such as NMN, NR, Epithalon, and GHK-Cu. The content is intended for laboratory researchers and is not medical advice.
What Epigenetic Clocks Measure: CpG Methylation
DNA methylation is a covalent modification in which a methyl group is added to the 5-carbon of cytosine, primarily at CpG dinucleotides. Methylation patterns change predictably with age at thousands of CpG sites, with some sites becoming hypermethylated and others hypomethylated. This bidirectional drift is tissue-dependent but shows strong enough age-correlation at specific CpGs to support quantitative age prediction from a methylation profile.
Input data for epigenetic clocks is typically generated by the Illumina Infinium MethylationEPIC array (850,000+ CpGs) or its predecessor the 450K array. Whole-genome bisulfite sequencing provides higher coverage but is rarely used clinically due to cost. Clock algorithms take methylation beta values (between 0 and 1) at defined CpGs as input and output a predicted age in years.
Horvath 2013: The Pan-Tissue Clock (353 CpGs)
Horvaths 2013 multi-tissue clock was trained on 8,000 samples across 51 tissue types using elastic net regression, selecting 353 CpGs whose weighted methylation values predict chronological age. It achieved a median absolute deviation of 3.6 years from chronological age across the training set and generalizes to most somatic tissues (Horvath, 2013).
The Horvath clock was the first to demonstrate that a single mathematical model could predict age across tissues as diverse as blood, brain, liver, and skin, reframing aging as a coordinated epigenetic program rather than a tissue-specific process. It remains the most widely cited clock in aging research but has been surpassed in predictive accuracy for mortality and disease by later models.
Hannum Clock: Blood-Specific Aging
The Hannum clock, published in 2013 shortly after Horvaths, is a blood-specific model using 71 CpGs selected from whole-blood methylation data of 656 individuals. It achieves higher accuracy than Horvath in blood samples (median absolute error approximately 3 years) but does not generalize to other tissues (Hannum et al., 2013).
Hannum demonstrated that age acceleration measured by this clock (the residual after regressing epigenetic age on chronological age) associates with all-cause mortality, making it one of the first clocks shown to carry information about biological rather than purely chronological aging. It remains a common choice for blood-based studies where tissue specificity is not a concern.
PhenoAge: Clinical Biomarker Integration
PhenoAge, developed by Levine et al. (2018), is a second-generation clock trained not against chronological age directly, but against a composite phenotypic age derived from nine clinical biomarkers (albumin, creatinine, glucose, C-reactive protein, lymphocyte percentage, mean cell volume, red cell distribution width, alkaline phosphatase, and white blood cell count) plus chronological age.
By training against a biomarker-defined phenotype rather than chronological age, PhenoAge selects CpGs informative for health status rather than time alone. It shows stronger associations with mortality and age-related disease than first-generation clocks, with each year of PhenoAge acceleration associated with a 4.5% increase in mortality risk in the training cohort.
DNAm GrimAge: Mortality Prediction Leader
DNAm GrimAge, published by Lu et al. (2019), is the current gold standard for mortality prediction among epigenetic clocks. It is a composite of DNA methylation-based surrogates for seven plasma proteins (including adrenomedullin, beta-2 microglobulin, cystatin C, GDF15, leptin, PAI-1, and TIMP-1) and DNA methylation-based smoking pack-years.
In the Framingham Heart Study cohort, one year of GrimAge acceleration was associated with a hazard ratio of 1.10 for all-cause mortality, outperforming both Horvath and PhenoAge. GrimAge2, an updated version published in 2022, incorporated additional surrogate biomarkers and improved mortality hazard ratios further (Lu et al., 2022).
DunedinPACE: Pace of Aging in Real Time
DunedinPACE (Pace of Aging Calculated from the Epigenome) is conceptually distinct from other clocks: rather than estimating cumulative biological age, it estimates the rate of aging – how fast a person is aging biologically at the time of sampling. The model was trained on 19 organ-system biomarkers measured longitudinally over 20 years in the Dunedin Study birth cohort (Belsky et al., 2022).
A DunedinPACE value of 1.0 indicates aging at the average rate (one year of biological aging per calendar year), while values below 1.0 indicate slower aging and above 1.0 faster aging. Because DunedinPACE measures rate rather than cumulative damage, it is more sensitive to short-term interventions and is increasingly used as a primary endpoint in longevity trials.
Use in Peptide Research: What Clocks Can and Cannot Show
Epigenetic clocks are attractive endpoints for longevity peptide research because they integrate thousands of molecular signals into a single quantitative output and correlate with hard endpoints such as mortality. Studies of caloric restriction, rapamycin, and metformin have used Horvath and GrimAge as outcome biomarkers. The TRIIM-X trial (Fahy et al., 2019) reported a 2.5-year reduction in epigenetic age after 1 year of a growth hormone-based protocol, though the study was small (10 participants) and uncontrolled.
For peptide research specifically, DunedinPACE may be more sensitive to short intervention windows (6-12 months) than cumulative clocks like Horvath. Clocks cannot distinguish between mechanisms of intervention (methylation changes could reflect upstream NAD+ metabolism, mitochondrial function, inflammation, or senolytic effects) and should be interpreted as downstream integrative biomarkers rather than mechanistic readouts.
Methodological Limitations and Analytical Variance
Epigenetic clock results are sensitive to technical variables including sample handling, DNA extraction method, bisulfite conversion efficiency, and array batch effects. Paired replicates from the same individual can show epigenetic age differences of 2-3 years due to technical noise alone. Cell-type composition of blood samples (neutrophils, lymphocytes, monocytes) affects methylation patterns and must be adjusted for using reference-based deconvolution.
Additionally, clocks trained on predominantly European-ancestry populations may show reduced accuracy in other populations. Clocks also do not capture all dimensions of biological aging: telomere length, mitochondrial function, and immune cell composition carry independent age information. A multi-biomarker panel including epigenetic clocks alongside complementary measures provides more robust assessment than any single clock in isolation.
References
- Horvath S (2013). DNA methylation age of human tissues and cell types. Genome Biol, 14(10):R115.
- Hannum G et al. (2013). Genome-wide methylation profiles reveal quantitative views of human aging rates. Mol Cell, 49(2):359-367.
- Levine ME et al. (2018). An epigenetic biomarker of aging for lifespan and healthspan. Aging (Albany NY), 10(4):573-591.
- Lu AT et al. (2019). DNA methylation GrimAge strongly predicts lifespan and healthspan. Aging (Albany NY), 11(2):303-327.
- Lu AT et al. (2022). DNA methylation GrimAge version 2. Aging (Albany NY), 14(23):9484-9549.
- Belsky DW et al. (2022). DunedinPACE, a DNA methylation biomarker of the pace of aging. eLife, 11:e73420.
- Fahy GM et al. (2019). Reversal of epigenetic aging and immunosenescent trends in humans. Aging Cell, 18(6):e13028.
- Bell CG et al. (2019). DNA methylation aging clocks: challenges and recommendations. Genome Biol, 20(1):249.
Further Reading on ChemVerify
- Read more: NAD+ Levels After Age 40 → https://www.chemverify.com/learn/nad-plus-levels-age-40-10-percent-decline-decade
- Read more: Best Longevity Peptide Stack 2026 → https://www.chemverify.com/learn/best-longevity-peptide-stack-2026-framework
- Read more: GHK-Cu Copper Peptide → https://www.chemverify.com/learn/ghk-cu-copper-peptide-most-studied-anti-aging
References
Compare Verified Vendors
Browse COA-verified suppliers with exclusive discount codes and transparent pricing.