
Complete Guide to Peptide Purity Testing: HPLC, Mass Spectrometry & CoA Verification
Comprehensive scientific guide to peptide purity analysis methods including reverse-phase HPLC, mass spectrometry, amino acid analysis, and Certificate of Analysis interpretation for laboratory researchers.
For laboratory research use only. Not for human consumption.
TL;DR: RP-HPLC at 220 nm UV detection is the gold standard for peptide purity determination. Research-grade peptides require ≥95% purity; high-purity grades exceed 98%. Mass spectrometry confirms molecular identity within ±1 Da. ChemVerify cross-references vendor HPLC data against independent third-party results from Janoshik Analytics.
Last verified: March 2026 | Data accuracy confirmed by ChemVerify Editorial Team
Introduction to Peptide Purity Testing
Peptide purity testing is the cornerstone of quality assurance in peptide research. Without verified purity data, experimental results become unreliable – impurities can introduce confounding variables, alter biological activity, or generate misleading dose-response curves. The three primary analytical methods used in peptide quality control are reverse-phase high-performance liquid chromatography (RP-HPLC), mass spectrometry (MS), and amino acid analysis (AAA). Each method answers a fundamentally different question about the peptide sample.
RP-HPLC measures chemical purity (how much of the sample is the target peptide vs. impurities). Mass spectrometry confirms molecular identity (is this actually the peptide we think it is?). Amino acid analysis verifies composition and net peptide content. Together, these three methods provide a comprehensive quality profile that responsible researchers should demand from any peptide supplier.
Reverse-Phase HPLC: The Gold Standard
Reverse-phase high-performance liquid chromatography (RP-HPLC) is the industry-standard method for assessing peptide purity. The technique separates molecules based on hydrophobicity: the peptide sample is dissolved in a polar mobile phase and passed through a column packed with hydrophobic C18 or C8 stationary phase material. Different molecular species in the sample interact with the stationary phase to varying degrees, causing them to elute at different times.
The key parameters that define an RP-HPLC purity analysis include the column chemistry (C18 is standard for most peptides, C4 or C8 for larger or more hydrophobic sequences), the mobile phase gradient (typically water/acetonitrile with 0.1% trifluoroacetic acid), the flow rate (commonly 1.0 mL/min for analytical columns), the detection wavelength (214 nm for peptide bond absorption, 280 nm for aromatic residues), and the column temperature (usually 25-40°C). The United States Pharmacopeia (USP) provides standardized HPLC methods for many therapeutic peptides, ensuring reproducibility across laboratories.
A well-resolved HPLC chromatogram should show a single dominant peak representing the target peptide, with the area under this peak expressed as a percentage of total peak area. Research-grade peptides typically require ≥95% purity by HPLC, while pharmaceutical-grade material demands ≥98%. Impurity peaks may represent deletion sequences (where one or more amino acids were missed during synthesis), oxidized variants, deamidated forms, or residual protecting groups from the synthesis process.
Interpreting HPLC Chromatograms
When reviewing an HPLC chromatogram, researchers should evaluate several critical features. The main peak should be well-resolved from neighboring peaks, with a symmetry factor between 0.8 and 1.5 (perfectly symmetric = 1.0). Severe peak tailing or fronting may indicate column overloading, secondary interactions with the stationary phase, or sample degradation.
- Retention time: Should be consistent with the expected hydrophobicity of the target peptide. Very early elution (< 5 min) suggests the peptide may be too hydrophilic for the column chemistry used.
- Peak area percentage: The ratio of the main peak area to total integrated peak area. This is the reported purity value. Ensure the integration parameters (baseline, threshold) are appropriate.
- Impurity profile: Clusters of small peaks near the main peak often indicate deletion sequences or truncated forms. A broad hump in the baseline suggests polymeric aggregates or incompletely resolved impurities.
- Baseline stability: A clean, flat baseline indicates proper instrument equilibration and mobile phase preparation. Baseline drift may compromise accurate integration.
- Gradient conditions: The chromatogram should include method details. A shallow gradient (0.5-1% B/min) provides better resolution than a steep gradient but increases run time.
Be cautious of reported purity values above 99%. While achievable for simple, short peptides, such high purities are unusual for complex sequences (>20 residues) or peptides containing difficult couplings. If a supplier reports 99.5% purity for a 40-residue peptide without providing the chromatogram, this warrants additional scrutiny.
Mass Spectrometry for Identity Confirmation
While HPLC measures how pure a sample is, mass spectrometry (MS) confirms what the sample actually is. The technique measures the mass-to-charge ratio (m/z) of ionized molecules, providing the molecular weight of the peptide with high accuracy. The two most common ionization methods for peptide analysis are electrospray ionization (ESI) and matrix-assisted laser desorption/ionization (MALDI).
ESI-MS is often coupled directly to HPLC (LC-MS), allowing simultaneous purity and identity analysis. ESI generates multiply charged ions, producing a characteristic charge envelope from which the molecular weight can be deconvoluted. For a peptide with a theoretical monoisotopic mass of 1,500.7 Da, acceptable observed masses would typically fall within ±1 Da for standard ESI-MS or ±0.5 Da for high-resolution instruments. MALDI-TOF MS provides rapid, high-throughput analysis and is particularly useful for peptides above 5,000 Da where ESI charge states become complex.
The mass spectrum should show a dominant signal at the expected molecular weight. Additional signals may indicate truncated sequences (mass lower than expected by the mass of one or more amino acid residues), oxidized forms (+16 Da per oxidation, common for methionine-containing peptides), sodium or potassium adducts (+22 or +38 Da), or TFA salt adducts (+114 Da). The absence of a signal at the expected mass is a definitive indicator that the sample is not the claimed peptide.
Amino Acid Analysis (AAA)
Amino acid analysis provides two critical pieces of information: the amino acid composition (confirming the correct ratio of residues) and the net peptide content (the actual mass of peptide in the sample, as opposed to counter-ions, water, and other non-peptide material). AAA involves complete hydrolysis of the peptide into its constituent amino acids, followed by derivatization and chromatographic quantification.
Net peptide content is often significantly lower than the weighed mass of a peptide sample. Lyophilized peptides typically contain 60-85% net peptide content, with the remainder consisting of counter-ions (TFA or acetate salts), residual water, and trace solvents. This distinction is critical for accurate experimental dosing: a researcher who weighs 10 mg of a lyophilized peptide with 70% net peptide content is actually working with only 7 mg of active peptide. Suppliers who report net peptide content on their CoA provide significantly more useful information than those who report only gross weight.
Additional Quality Metrics
Beyond the three primary methods, several additional analytical techniques may appear on comprehensive Certificates of Analysis:
- Endotoxin testing (LAL assay): Measures bacterial endotoxin contamination. Critical for in vivo research. Acceptable levels are typically <1 EU/mg for research-grade and <0.25 EU/mg for cell culture applications.
- Residual solvent analysis (GC-MS): Quantifies residual organic solvents from purification (acetonitrile, TFA, DMF). ICH Q3C guidelines define acceptable limits for each solvent class.
- Water content (Karl Fischer titration): Determines moisture content in lyophilized peptides. Typical values range from 2-8%. High water content may indicate incomplete lyophilization and can accelerate degradation.
- Peptide sequence analysis (Edman degradation or MS/MS): Provides definitive sequence confirmation by fragmenting the peptide and analyzing the resulting fragment ion series. This is the most conclusive identity test available.
- Appearance and solubility: Physical description (white to off-white powder) and solubility in standard solvents (water, DMSO, dilute acetic acid) provide basic quality indicators.
Reading a Certificate of Analysis
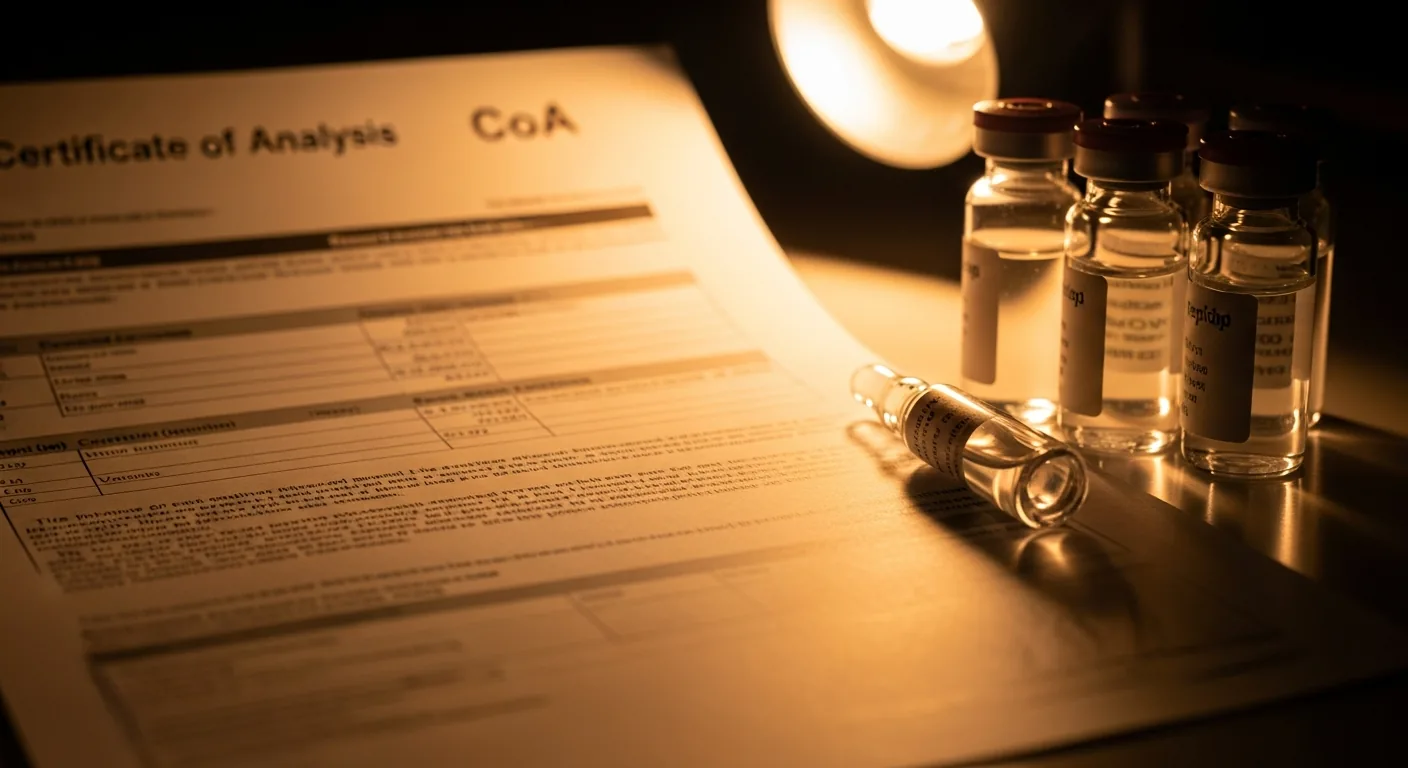
A Certificate of Analysis (CoA) is the primary quality document accompanying a peptide product. A reliable CoA should contain: the peptide name and sequence, the lot/batch number, the synthesis and analysis dates, HPLC purity with method details and chromatogram, MS data with observed and theoretical molecular weight, net peptide content (if AAA was performed), storage recommendations, and the name or identifier of the analyzing laboratory.
The most important distinction when evaluating a CoA is whether the analysis was performed in-house by the manufacturer or by an independent third-party laboratory. Third-party analysis eliminates the conflict of interest inherent in self-testing. Accredited testing laboratories (ISO 17025 or GLP-compliant) follow validated, standardized methods and maintain quality management systems that ensure data integrity. ChemVerify verifies CoA data by cross-referencing reported values with third-party laboratory results.
Red Flags in Purity Data
Researchers should be alert to several warning signs when reviewing peptide quality documentation:
- Missing chromatogram: A CoA that reports purity percentage without including the actual HPLC chromatogram cannot be independently verified. The chromatogram is the raw data – without it, the number is just a claim.
- Inconsistent molecular weight: If the MS-observed mass differs from the theoretical mass by more than ±2 Da (for standard instruments), the sample may not be the claimed peptide or may contain significant modifications.
- No batch number: Without a unique batch identifier, it is impossible to trace the material or verify that the CoA corresponds to the specific product received.
- Suspiciously high purity for complex peptides: Peptides longer than 30 residues with reported purities above 99% should be viewed with skepticism unless accompanied by high-resolution chromatographic data.
- No date or laboratory identification: A CoA without analysis date or laboratory name has no provenance and cannot be verified.
- Generic or template CoAs: Some suppliers use identical CoA formats across all products with only the peptide name changed, suggesting automated document generation rather than actual batch-specific analysis.
Third-Party vs. In-House Testing
The distinction between third-party and in-house testing is perhaps the single most important quality indicator for research peptides. In-house testing, where the manufacturer analyzes their own products, presents an inherent conflict of interest. While many reputable manufacturers maintain excellent internal quality control, the incentive structure favors reporting favorable results. Third-party testing by independent, accredited laboratories removes this conflict entirely.
Independent testing laboratories used in this field include Janoshik Analytical (Czech Republic), MZ Biolabs (United States), and Vanguard Laboratory. Accreditation status differs between them and should be checked against each laboratory's own published scope; what they share is that they have no financial relationship with the peptide suppliers whose products they test. When a supplier provides third-party CoA data, researchers can have significantly higher confidence in the reported values.
ChemVerify maintains a database of verified batch analyses from independent laboratories, providing researchers with an objective quality comparison across suppliers. Our verification process cross-references supplier-provided CoA data against independent test results to identify discrepancies.
Summary: Which Method for Which Question?
- Is my sample pure? → RP-HPLC (reports percentage purity based on chromatographic peak area)
- Is my sample the correct peptide? → Mass Spectrometry (confirms molecular weight matches theoretical value)
- What is the actual peptide content by weight? → Amino Acid Analysis (reports net peptide content excluding salts and water)
- Is my sample free from bacterial contamination? → LAL Endotoxin Assay (critical for in vivo applications)
- Is the reported quality data trustworthy? → Third-party CoA verification (removes conflict of interest from self-testing)
No single analytical method provides a complete quality picture. Responsible peptide quality assessment requires a combination of orthogonal techniques. At minimum, researchers should demand HPLC purity data with chromatogram and MS identity confirmation for any peptide used in scientific research.
Frequently Asked Questions
What is considered acceptable purity for research-grade peptides?
Research-grade peptides typically require ≥95% HPLC purity. For sensitive applications such as receptor binding assays or cell culture studies, high-purity grades (≥98%) are recommended. Purity is measured by integrating the area under the main HPLC peak relative to total peak area at 220 nm UV detection.
Why do some vendors report purity above 99% – is that realistic?
While >99% purity is achievable for short, simple peptides (5–10 residues), it is uncommon for longer or modified sequences. Reported purities consistently above 99% across diverse peptide catalogs may indicate optimistic integration methods or selective peak exclusion. Always request the full chromatogram for independent verification.
What is the difference between HPLC purity and mass spec confirmation?
HPLC purity measures chemical purity – the percentage of the sample that is the target peptide versus impurities. Mass spectrometry confirms molecular identity by measuring the molecular weight. A peptide can show high HPLC purity but incorrect MW (wrong sequence), or correct MW with low purity (correct peptide present but with many impurities). Both tests are complementary and essential.
How does ChemVerify verify peptide purity claims?
ChemVerify reviews vendor-provided HPLC and MS data for completeness and internal consistency. Batch-specific documentation is evaluated for chromatogram authenticity, correct mass spectral data, and consistency across multiple production lots.
Compounds Referenced in This Article
Explore detailed chemical profiles and research guides for compounds discussed in this article:
- BPC-157: Complete Research Guide → /learn/bpc-157
- GHK-Cu: Complete Research Guide → /learn/ghk-cu
- Semaglutide: Complete Research Guide → /learn/semaglutide
- TB-500: Complete Research Guide → /learn/tb-500
Further Reading on ChemVerify
- Read more: Peptide Purity vs Net Peptide Content (NPC): The Critical Difference Explained → https://www.chemverify.com/learn/peptide-purity-vs-net-peptide-content-npc
- Read more: HPLC Column Selection Guide for Peptide Analysis → https://www.chemverify.com/learn/hplc-column-selection-guide
- Read more: Research Peptide Vendor Verification: The Complete Quality Checklist → https://www.chemverify.com/learn/vendor-verification-checklist
- Read more: How to Read a Certificate of Analysis (CoA): A Step-by-Step Guide for Researchers → https://www.chemverify.com/learn/how-to-read-coa
References
Compare Verified Vendors
Browse COA-verified suppliers with exclusive discount codes and transparent pricing.
You Might Also Like
Continue Reading
HPLC Column Selection Guide for Peptide Analysis
Practical guide to selecting the optimal HPLC column for peptide analysis. Compares C18, C8, and C4 stationary phases, pore sizes, particle sizes, and gradient optimization strategies.
How to Read a Certificate of Analysis (CoA): A Step-by-Step Guide for Researchers
Step-by-step guide to interpreting Certificates of Analysis for research peptides. Learn to evaluate HPLC purity data, mass spectrometry results, net peptide content, and identify unreliable documentation.
Research Peptide Vendor Verification: The Complete Quality Checklist
A systematic, evidence-based checklist for evaluating research peptide suppliers. Covers CoA verification, testing standards, transparency indicators, and warning signs of unreliable vendors.
Peptide Purity vs Net Peptide Content (NPC): The Critical Difference Explained
Peptide purity (HPLC %) and net peptide content (NPC) measure different things. A 98% pure peptide may contain only 65% actual peptide by weight. Learn to read COAs and calculate real dosing.